


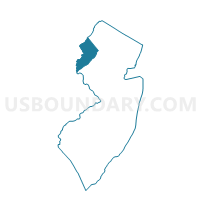
Warren County, New Jersey
About
Outline

Summary
| Unique Area Identifier | 120651 |
| Name | Warren County |
| State | New Jersey |
| Area (square miles) | 362.86 |
| Land Area (square miles) | 356.92 |
| Water Area (square miles) | 5.94 |
| % of Land Area | 98.36 |
| % of Water Area | 1.64 |
| Latitude of the Internal Point | 40.85352380 |
| Longtitude of the Internal Point | -75.00954210 |
| Total Population | 108,692 |
| Total Housing Units | 44,925 |
| Total Households | 41,480 |
| Median Age | 41.5 |
Maps
Graphs
Select a template below for downloading or customizing gragh for Warren County, New Jersey


Neighbors
Neighoring County (by Name) Neighboring County on the Map
- Bucks County, PA
- Hunterdon County, NJ
- Monroe County, PA
- Morris County, NJ
- Northampton County, PA
- Sussex County, NJ
County Subdivision in Warren County (by Name) Neighboring County Subdivision on the Map
- Allamuchy township, Warren County, NJ
- Alpha borough, Warren County, NJ
- Belvidere town, Warren County, NJ
- Blairstown township, Warren County, NJ
- Franklin township, Warren County, NJ
- Frelinghuysen township, Warren County, NJ
- Greenwich township, Warren County, NJ
- Hackettstown town, Warren County, NJ
- Hardwick township, Warren County, NJ
- Harmony township, Warren County, NJ
- Hope township, Warren County, NJ
- Independence township, Warren County, NJ
- Knowlton township, Warren County, NJ
- Liberty township, Warren County, NJ
- Lopatcong township, Warren County, NJ
- Mansfield township, Warren County, NJ
- Oxford township, Warren County, NJ
- Phillipsburg town, Warren County, NJ
- Pohatcong township, Warren County, NJ
- Washington borough, Warren County, NJ
- Washington township, Warren County, NJ
- White township, Warren County, NJ
Top 10 Neighboring Place (by Population) Neighboring Place on the Map
- Easton city, PA (26,800)
- Phillipsburg town, NJ (14,950)
- Hackettstown town, NJ (9,724)
- Washington borough, NJ (6,461)
- Beattystown CDP, NJ (4,554)
- Panther Valley CDP, NJ (3,327)
- Greenwich CDP, NJ (2,755)
- Belvidere town, NJ (2,681)
- Alpha borough, NJ (2,369)
- Upper Pohatcong CDP, NJ (1,781)
Top 10 Neighboring Elementary School District (by Population) Neighboring Elementary School District on the Map
- Washington Township School District, NJ (18,533)
- Byram Township School District, NJ (8,350)
- Lopatcong Township School District, NJ (8,014)
- Mansfield Township School District, NJ (7,725)
- Blairstown Township School District, NJ (7,663)
- Washington Township School District, NJ (6,651)
- Lebanon Township School District, NJ (6,588)
- Washington Borough School District, NJ (6,461)
- Greenwich Township School District, NJ (5,712)
- Holland Township School District, NJ (5,291)
Top 10 Neighboring Secondary School District (by Population) Neighboring Secondary School District on the Map
- North Hunterdon-Voorhees Regional School District, NJ (51,047)
- West Morris Regional School District, NJ (38,870)
- Warren Hills Regional School District, NJ (24,013)
- Delaware Valley Regional School District, NJ (16,680)
- Lenape Valley Regional School District, NJ (15,192)
- Kittatinny Regional School District, NJ (14,746)
- North Warren Regional School District, NJ (12,948)
Top 10 Neighboring Unified School District (by Population) Neighboring Unified School District on the Map
- Easton Area School District, PA (63,870)
- East Stroudsburg Area School District, PA (47,915)
- Stroudsburg Area School District, PA (34,609)
- Mount Olive Township School District, NJ (28,117)
- Bangor Area School District, PA (22,655)
- Wilson Area School District, PA (15,477)
- Phillipsburg Town School District, NJ (14,950)
- Hackettstown Town School District, NJ (9,724)
- Great Meadows Regional School District, NJ (8,604)
- Belvidere Town School District, NJ (2,681)
Top 10 Neighboring State Legislative District Lower Chamber (by Population) Neighboring State Legislative District Lower Chamber on the Map
- General Assembly District 23, NJ (229,972)
- General Assembly District 24, NJ (215,703)
- State House District 189, PA (76,401)
- State House District 137, PA (72,979)
- State House District 136, PA (63,631)
- State House District 143, PA (62,909)
Top 10 Neighboring State Legislative District Upper Chamber (by Population) Neighboring State Legislative District Upper Chamber on the Map
- State Senate District 24, PA (278,648)
- State Senate District 20, PA (273,416)
- State Senate District 18, PA (267,805)
- State Senate District 23, NJ (229,972)
- State Senate District 24, NJ (215,703)
Top 10 Neighboring 111th Congressional District (by Population) Neighboring 111th Congressional District on the Map
- Congressional District 15, PA (721,828)
- Congressional District 11, PA (687,860)
- Congressional District 11, NJ (674,349)
- Congressional District 7, NJ (672,885)
- Congressional District 8, PA (672,685)
- Congressional District 5, NJ (666,551)
Top 10 Census Tract in Warren County (by Population) Neighboring Census Tract on the Map
- Census Tract 322, Warren County, NJ (8,014)
- Census Tract 312, Warren County, NJ (7,949)
- Census Tract 315, Warren County, NJ (7,725)
- Census Tract 319, Warren County, NJ (6,651)
- Census Tract 320, Warren County, NJ (6,461)
- Census Tract 311.01, Warren County, NJ (5,976)
- Census Tract 321.02, Warren County, NJ (5,712)
- Census Tract 313.01, Warren County, NJ (5,662)
- Census Tract 314.02, Warren County, NJ (5,134)
- Census Tract 307, Warren County, NJ (5,021)
Top 10 Neighboring 5-Digit ZIP Code Tabulation Area (by Population) Neighboring 5-Digit ZIP Code Tabulation Area on the Map
- 18042, PA (41,570)
- 07840, NJ (29,849)
- 08865, NJ (29,840)
- 18301, PA (28,561)
- 07860, NJ (26,288)
- 18013, PA (17,802)
- 18302, PA (17,362)
- 18040, PA (15,742)
- 07882, NJ (14,492)
- 07828, NJ (14,150)
Data
Demographic, Population, Households, and Housing Units
** Data sources from census 2010 **
Show Data on Map
Download Full List as CSV
Download Quick Sheet as CSV
| Subject | This Area | New Jersey | National |
|---|---|---|---|
| POPULATION | |||
| Total Population Map | 108,692 | 8,791,894 | 308,745,538 |
| POPULATION, HISPANIC OR LATINO ORIGIN | |||
| Not Hispanic or Latino Map | 101,033 | 7,236,750 | 258,267,944 |
| Hispanic or Latino Map | 7,659 | 1,555,144 | 50,477,594 |
| POPULATION, RACE | |||
| White alone Map | 98,137 | 6,029,248 | 223,553,265 |
| Black or African American alone Map | 3,818 | 1,204,826 | 38,929,319 |
| American Indian and Alaska Native alone Map | 155 | 29,026 | 2,932,248 |
| Asian alone Map | 2,673 | 725,726 | 14,674,252 |
| Native Hawaiian and Other Pacific Islander alone Map | 30 | 3,043 | 540,013 |
| Some Other Race alone Map | 1,964 | 559,722 | 19,107,368 |
| Two or More Races Map | 1,915 | 240,303 | 9,009,073 |
| POPULATION, SEX | |||
| Male Map | 52,828 | 4,279,600 | 151,781,326 |
| Female Map | 55,864 | 4,512,294 | 156,964,212 |
| POPULATION, AGE (18 YEARS) | |||
| 18 years and over Map | 83,084 | 6,726,680 | 234,564,071 |
| Under 18 years | 25,608 | 2,065,214 | 74,181,467 |
| POPULATION, AGE | |||
| Under 5 years | 6,084 | 541,020 | 20,201,362 |
| 5 to 9 years | 7,133 | 564,750 | 20,348,657 |
| 10 to 14 years | 7,592 | 587,335 | 20,677,194 |
| 15 to 17 years | 4,799 | 372,109 | 12,954,254 |
| 18 and 19 years | 2,804 | 225,990 | 9,086,089 |
| 20 years | 1,282 | 108,760 | 4,519,129 |
| 21 years | 1,220 | 106,219 | 4,354,294 |
| 22 to 24 years | 3,329 | 326,259 | 12,712,576 |
| 25 to 29 years | 5,227 | 553,139 | 21,101,849 |
| 30 to 34 years | 5,444 | 556,662 | 19,962,099 |
| 35 to 39 years | 6,886 | 588,379 | 20,179,642 |
| 40 to 44 years | 8,598 | 649,918 | 20,890,964 |
| 45 to 49 years | 9,816 | 704,516 | 22,708,591 |
| 50 to 54 years | 9,358 | 674,680 | 22,298,125 |
| 55 to 59 years | 7,490 | 565,623 | 19,664,805 |
| 60 and 61 years | 2,687 | 201,084 | 7,113,727 |
| 62 to 64 years | 3,651 | 279,458 | 9,704,197 |
| 65 and 66 years | 1,944 | 149,028 | 5,319,902 |
| 67 to 69 years | 2,722 | 201,944 | 7,115,361 |
| 70 to 74 years | 3,259 | 260,462 | 9,278,166 |
| 75 to 79 years | 2,764 | 215,715 | 7,317,795 |
| 80 to 84 years | 2,287 | 179,233 | 5,743,327 |
| 85 years and over | 2,316 | 179,611 | 5,493,433 |
| MEDIAN AGE BY SEX | |||
| Both sexes Map | 41.50 | 39.00 | 37.20 |
| Male Map | 40.40 | 37.40 | 35.80 |
| Female Map | 42.50 | 40.30 | 38.50 |
| HOUSEHOLDS | |||
| Total Households Map | 41,480 | 3,214,360 | 116,716,292 |
| HOUSEHOLDS, HOUSEHOLD TYPE | |||
| Family households: Map | 28,850 | 2,226,606 | 77,538,296 |
| Husband-wife family Map | 22,853 | 1,643,377 | 56,510,377 |
| Other family: Map | 5,997 | 583,229 | 21,027,919 |
| Male householder, no wife present Map | 1,771 | 154,134 | 5,777,570 |
| Female householder, no husband present Map | 4,226 | 429,095 | 15,250,349 |
| Nonfamily households: Map | 12,630 | 987,754 | 39,177,996 |
| Householder living alone Map | 10,382 | 811,221 | 31,204,909 |
| Householder not living alone Map | 2,248 | 176,533 | 7,973,087 |
| HOUSEHOLDS, HISPANIC OR LATINO ORIGIN OF HOUSEHOLDER | |||
| Not Hispanic or Latino householder: Map | 39,416 | 2,777,617 | 103,254,926 |
| Hispanic or Latino householder: Map | 2,064 | 436,743 | 13,461,366 |
| HOUSEHOLDS, RACE OF HOUSEHOLDER | |||
| Householder who is White alone | 38,421 | 2,340,060 | 89,754,352 |
| Householder who is Black or African American alone | 1,277 | 428,304 | 14,129,983 |
| Householder who is American Indian and Alaska Native alone | 50 | 8,686 | 939,707 |
| Householder who is Asian alone | 776 | 223,319 | 4,632,164 |
| Householder who is Native Hawaiian and Other Pacific Islander alone | 10 | 925 | 143,932 |
| Householder who is Some Other Race alone | 546 | 152,495 | 4,916,427 |
| Householder who is Two or More Races | 400 | 60,571 | 2,199,727 |
| HOUSEHOLDS, HOUSEHOLD TYPE BY HOUSEHOLD SIZE | |||
| Family households: Map | 28,850 | 2,226,606 | 77,538,296 |
| 2-person household Map | 11,761 | 812,884 | 31,882,616 |
| 3-person household Map | 6,681 | 539,679 | 17,765,829 |
| 4-person household Map | 6,342 | 498,316 | 15,214,075 |
| 5-person household Map | 2,702 | 228,492 | 7,411,997 |
| 6-person household Map | 913 | 86,142 | 3,026,278 |
| 7-or-more-person household Map | 451 | 61,093 | 2,237,501 |
| Nonfamily households: Map | 12,630 | 987,754 | 39,177,996 |
| 1-person household Map | 10,382 | 811,221 | 31,204,909 |
| 2-person household Map | 1,970 | 144,798 | 6,360,012 |
| 3-person household Map | 166 | 18,350 | 992,156 |
| 4-person household Map | 63 | 7,791 | 411,171 |
| 5-person household Map | 32 | 3,235 | 126,634 |
| 6-person household Map | 11 | 1,302 | 48,421 |
| 7-or-more-person household Map | 6 | 1,057 | 34,693 |
| HOUSING UNITS | |||
| Total Housing Units Map | 44,925 | 3,553,562 | 131,704,730 |
| HOUSING UNITS, OCCUPANCY STATUS | |||
| Occupied Map | 41,480 | 3,214,360 | 116,716,292 |
| Vacant Map | 3,445 | 339,202 | 14,988,438 |
| HOUSING UNITS, OCCUPIED, TENURE | |||
| Owned with a mortgage or a loan Map | 23,142 | 1,532,012 | 52,979,430 |
| Owned free and clear Map | 7,848 | 570,453 | 23,006,644 |
| Renter occupied Map | 10,490 | 1,111,895 | 40,730,218 |
| HOUSING UNITS, VACANT, VACANCY STATUS | |||
| For rent Map | 1,213 | 92,118 | 4,137,567 |
| Rented, not occupied Map | 50 | 4,578 | 206,825 |
| For sale only Map | 587 | 39,260 | 1,896,796 |
| Sold, not occupied Map | 116 | 8,145 | 421,032 |
| For seasonal, recreational, or occasional use Map | 457 | 134,903 | 4,649,298 |
| For migrant workers Map | 5 | 156 | 24,161 |
| Other vacant Map | 1,017 | 60,042 | 3,652,759 |
| HOUSING UNITS, OCCUPIED, AVERAGE HOUSEHOLD SIZE BY TENURE | |||
| Total: Map | 2.57 | 2.68 | 2.58 |
| Owner occupied Map | 2.71 | 2.79 | 2.65 |
| Renter occupied Map | 2.18 | 2.47 | 2.44 |
| HOUSING UNITS, OCCUPIED, TENURE BY RACE OF HOUSEHOLDER | |||
| Owner occupied: Map | 30,990 | 2,102,465 | 75,986,074 |
| Householder who is White alone Map | 29,228 | 1,717,602 | 63,446,275 |
| Householder who is Black or African American alone Map | 726 | 171,748 | 6,261,464 |
| Householder who is American Indian and Alaska Native alone Map | 26 | 3,523 | 509,588 |
| Householder who is Asian alone Map | 547 | 137,287 | 2,688,861 |
| Householder who is Native Hawaiian and Other Pacific Islander alone Map | 3 | 375 | 61,911 |
| Householder who is Some Other Race alone Map | 221 | 45,382 | 1,975,817 |
| Householder who is Two or More Races Map | 239 | 26,548 | 1,042,158 |
| Renter occupied: Map | 10,490 | 1,111,895 | 40,730,218 |
| Householder who is White alone Map | 9,193 | 622,458 | 26,308,077 |
| Householder who is Black or African American alone Map | 551 | 256,556 | 7,868,519 |
| Householder who is American Indian and Alaska Native alone Map | 24 | 5,163 | 430,119 |
| Householder who is Asian alone Map | 229 | 86,032 | 1,943,303 |
| Householder who is Native Hawaiian and Other Pacific Islander alone Map | 7 | 550 | 82,021 |
| Householder who is Some Other Race alone Map | 325 | 107,113 | 2,940,610 |
| Householder who is Two or More Races Map | 161 | 34,023 | 1,157,569 |
| HOUSING UNITS, OCCUPIED, TENURE BY HISPANIC OR LATINO ORIGIN OF HOUSEHOLDER | |||
| Owner occupied: Map | 30,990 | 2,102,465 | 75,986,074 |
| Not Hispanic or Latino householder Map | 29,882 | 1,943,837 | 69,617,625 |
| Hispanic or Latino householder Map | 1,108 | 158,628 | 6,368,449 |
| Renter occupied: Map | 10,490 | 1,111,895 | 40,730,218 |
| Not Hispanic or Latino householder Map | 9,534 | 833,780 | 33,637,301 |
| Hispanic or Latino householder Map | 956 | 278,115 | 7,092,917 |
| HOUSING UNITS, OCCUPIED, TENURE BY HOUSEHOLD SIZE | |||
| Owner occupied: Map | 30,990 | 2,102,465 | 75,986,074 |
| 1-person household Map | 5,933 | 418,027 | 16,453,569 |
| 2-person household Map | 10,921 | 671,621 | 27,618,605 |
| 3-person household Map | 5,386 | 378,218 | 12,517,563 |
| 4-person household Map | 5,423 | 373,606 | 10,998,793 |
| 5-person household Map | 2,270 | 166,068 | 5,057,765 |
| 6-person household Map | 720 | 58,752 | 1,965,796 |
| 7-or-more-person household Map | 337 | 36,173 | 1,373,983 |
| Renter occupied: Map | 10,490 | 1,111,895 | 40,730,218 |
| 1-person household Map | 4,449 | 393,194 | 14,751,340 |
| 2-person household Map | 2,810 | 286,061 | 10,624,023 |
| 3-person household Map | 1,461 | 179,811 | 6,240,422 |
| 4-person household Map | 982 | 132,501 | 4,626,453 |
| 5-person household Map | 464 | 65,659 | 2,480,866 |
| 6-person household Map | 204 | 28,692 | 1,108,903 |
| 7-or-more-person household Map | 120 | 25,977 | 898,211 |
Loading...